Difference between revisions of "File:Main belt e vs a.png"
Jump to navigation
Jump to search
(Plot of eccentricity vs semi-major axis for numbered asteroids inward of about 6 AU. The main belt region is shown in red, and contains 93.4% of all the objects. For reference, Mars orbits out to 1.666 AU, and Jupiter between 4.95 and 5.46 AU. The diagr) |
(Added category.) |
||
| Line 4: | Line 4: | ||
The diagram was created by Piotr Deuar using orbit data for 120437 numbered minor planets from the Minor Planet Center orbit databse, dated 8 Feb 2006. | The diagram was created by Piotr Deuar using orbit data for 120437 numbered minor planets from the Minor Planet Center orbit databse, dated 8 Feb 2006. | ||
| + | |||
| + | |||
| + | [[Category: Images]] | ||
Latest revision as of 11:12, 3 June 2021
Plot of eccentricity vs semi-major axis for numbered asteroids inward of about 6 AU. The main belt region is shown in red, and contains 93.4% of all the objects.
For reference, Mars orbits out to 1.666 AU, and Jupiter between 4.95 and 5.46 AU.
The diagram was created by Piotr Deuar using orbit data for 120437 numbered minor planets from the Minor Planet Center orbit databse, dated 8 Feb 2006.
File history
Click on a date/time to view the file as it appeared at that time.
| Date/Time | Thumbnail | Dimensions | User | Comment | |
|---|---|---|---|---|---|
| current | 22:24, 14 July 2006 | 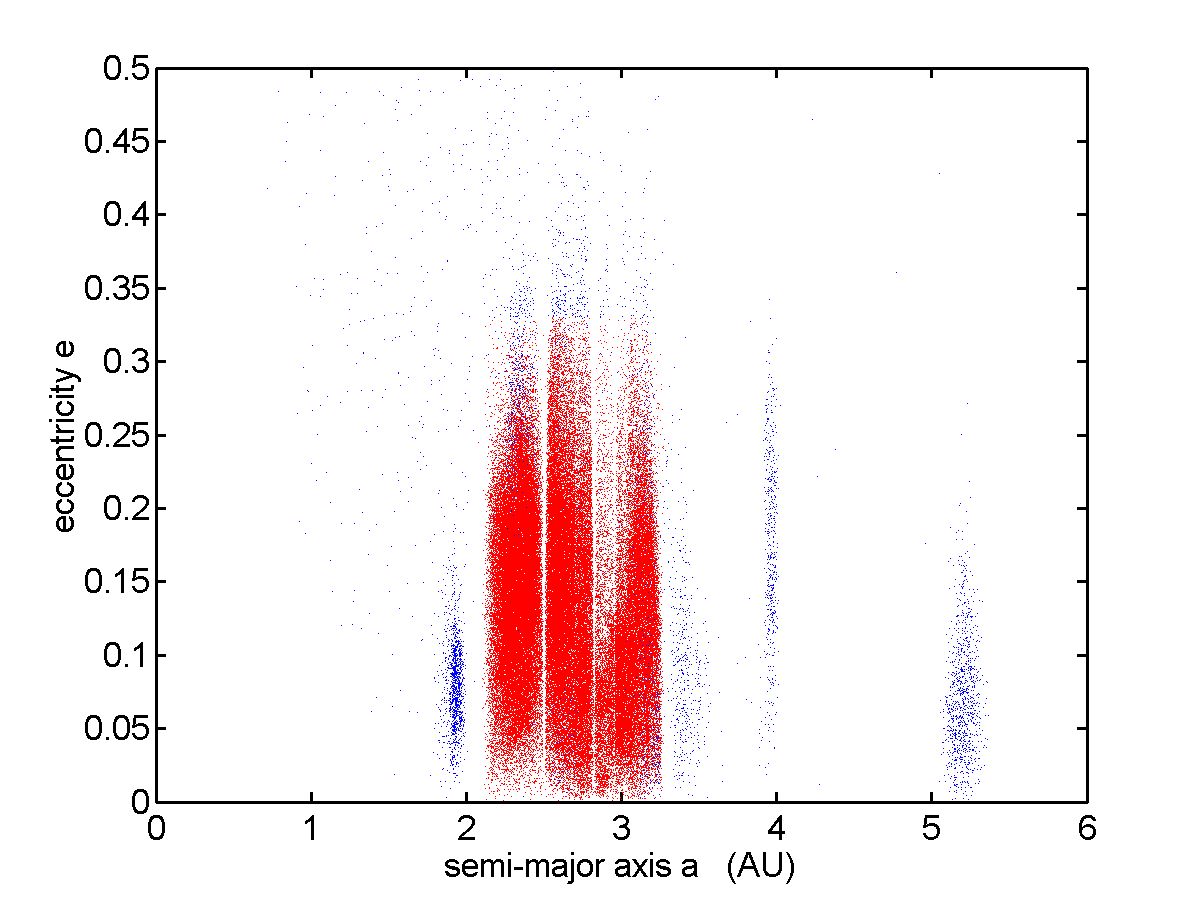 | 1,201 × 901 (49 KB) | Urwumpe (talk | contribs) | Plot of eccentricity vs semi-major axis for numbered asteroids inward of about 6 AU. The main belt region is shown in red, and contains 93.4% of all the objects. For reference, Mars orbits out to 1.666 AU, and Jupiter between 4.95 and 5.46 AU. The diagr |
You cannot overwrite this file.
File usage
The following page uses this file: